
The test you took measured your performance on chest compressions. The report provides a synopsis of that performance on parameters related to how important they are to a victim’s survival. There are 2 aspects to the report:
- Absolute performance scores (real measured scores on each parameter)
- Scores compared with AHA guideline requirements (your scores compared with the standards set in the guidelines)
Both the graph and the charts display the same information. The charts provide a more accurate analysis for you to examine after you have finished. The bar graph shows you at a glance what is correct and what needs to be adjusted. Also the bar graph is provided in real time as the chest is compressed. This allows you to “see” your performance as you do it, so you can modify whichever parameters are necessary. Both the bar graph and the detailed analysis are available immediately or you can access them at a later time.
Percentage Score
Your percentage is a weighted score to give you a quick indication of how well you have performed. The weightings are arrived at through the following formula:
10% Score in the Depth Chart
10% Score in the Rate Chart
10% Score in the Chest Release Chart
50% In compliance (Overall)
20% Rate is calculated by how close you come to the ideal time.
The Bar Graph
This is produced in real time as you press the chest. On the graph there are three lines to indicate how deeply the chest is being compressed; 1.5 inches 1.75 inches and 2.0 inches. AHA guidelines recommend that all compressions be performed within this range.
The colors in the graph give you a quick visual representation of how well you are performing.
![]()
![]() Light Green. This means the compression is being delivered at the correct depth and was performed at the correct rate.
Light Green. This means the compression is being delivered at the correct depth and was performed at the correct rate.
![]() Dark Green: The compression is too deep but the rate was correct. The depth is indicated by the length of the bar.
Dark Green: The compression is too deep but the rate was correct. The depth is indicated by the length of the bar.
![]() Orange: The compression is too fast. The depth is indicated by the length of the bar.
Orange: The compression is too fast. The depth is indicated by the length of the bar.
![]() Red: The rate is too slow. The depth is indicated by the length of the bar.
Red: The rate is too slow. The depth is indicated by the length of the bar.
![]() Chest Not Released: SmartMan is able to measure much more accurately than a person is able to detect. Sometimes the bar graph will start above the bottom line. This means that you did not allow the chest to fully release. If you kept the chest pressed more than 1/10th of an inch this will be shown as a red bar. This signifies a non-released compression.
Chest Not Released: SmartMan is able to measure much more accurately than a person is able to detect. Sometimes the bar graph will start above the bottom line. This means that you did not allow the chest to fully release. If you kept the chest pressed more than 1/10th of an inch this will be shown as a red bar. This signifies a non-released compression.
Chest Not Fully Released: If you kept the chest compressed less than 1/10th of an inch the bar graph will still not start at the bottom but it will still be calculated as an effective compression.
The Charts
Chart Indicating Depth of Compressions
This groups your results into ½ inch ranges. It shows the number of compressions which were performed within each range. The AHA recommended range for depth is 1.5 – 2.0 inches. These are shown in green in the display. In the example below, 86 compressions were performed between 1.5 - 2.0 inches. 64 compressions were performed between 2.0 - 2.5 inches. The target range is 1.5 - 2.0 inches. In this set of 150 compression 57.3% (the number shown in green as the score) were within the recommended depth range.
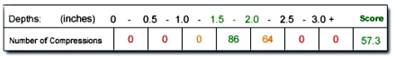
Chart Indicating Rate of Compressions
This groups your results into 0.1 second ranges. It shows the number of compressions which were performed within each range. The AHA recommended range is 0.5 - 0.7 seconds which gives an average of 100 compressions per minute. These are shown in green.
In the example below, 32 compressions were performed between 0.5 -0.6 seconds and 112 compressions were performed between 0.6 and 0.7 seconds. 4 compressions were performed between 0.7 and 0.9 seconds and 4 compressions were performed above 0.8 seconds. This means that overall 96% of all compression rates met the AHA guidelines.
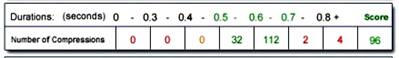
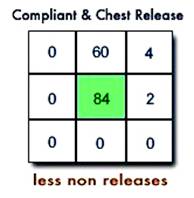
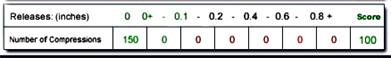
Chart Indicating Number of Chest Releases
This groups your results into 0.1 inch ranges relative to a full release. It shows how far you allowed the chest to return towards its natural at rest position before you began the next compression. AHA guidelines recommend full release. In the example below, all compressions which were performed within the range. .
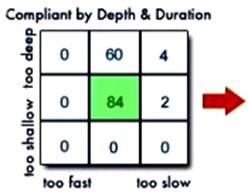
The Matrices
The numbers in the charts give you a score based on component skills. They show how you performed in depth (by itself) and in rate (by itself). The matrices provide an accurate description of all your skills when combined in real time and thus indicate how depth and rate were actually performed.
This gives a total of the compressions which were performed within the tolerances suggested by the guidelines. There are 9 numbers in the cube. The bottom row displays compressions that were too shallow and the top row shows compressions that were too deep. The left column shows compressions that were too fast and the right column shows those that were too slow. The target area for the scores is shown in green.;
Too Deep |
Too Deep |
Too Deep |
Correct Depth |
Correct Depth |
Correct Depth |
Too Shallow |
Too Shallow |
Too Shallow |
|
|
|